A Real Estate Tale of Three Cities – Charleston, James Island & Mount Pleasant
This is a Tale of Three Cities….sort of….
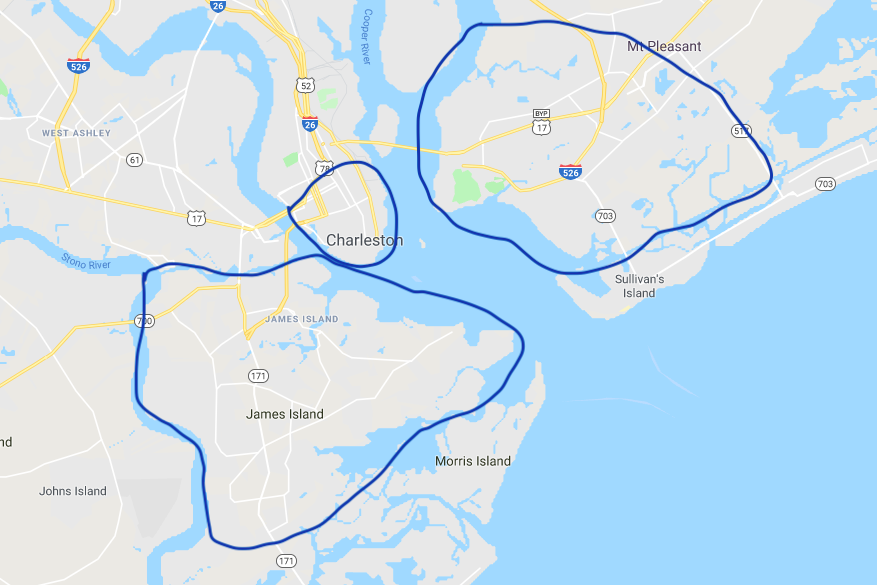
Let’s take a look at what’s happening in the real estate market in three locales: Downtown Charleston (south of the Crosstown), James Island (technically mostly also Charleston), and Mount Pleasant (south of the Isle of Palms Connector). The Spring selling and buying surge is over, and the numbers that tell a tale are in….While the Charleston market overall is basically level compared to last year, we are seeing some changes by area, and while these three areas are vastly different, I think it’s interesting to see what is going on in each, all influenced by local and external market forces.
Closed Sales
In this graph below showing the number of sales of single family homes, you can see Downtown sales are off by 20% over last year. I believe this is partly due to softer markets in our feeder regions – mainly, the Northeast. The mansion tax, an oversupply, and a fleeing of foreign buyers has created the longest downturn in the market there in over three decades. How does that affect us?? If Northeasterners can’t sell there, they can’t buy here and for a decade they have been coming to Charleston in droves.
In a drastic comparison, you can see that James Island sales are actually UP 22% over last year. What is driving that?? Affordability. As one of the closest bedroom communities to Downtown (15 minutes or less), you can get so much more house for your money than you can on the other side in Mount Pleasant. As a result, Mount Pleasant sales have declined by 3.6% – nothing crazy, but still something to watch.
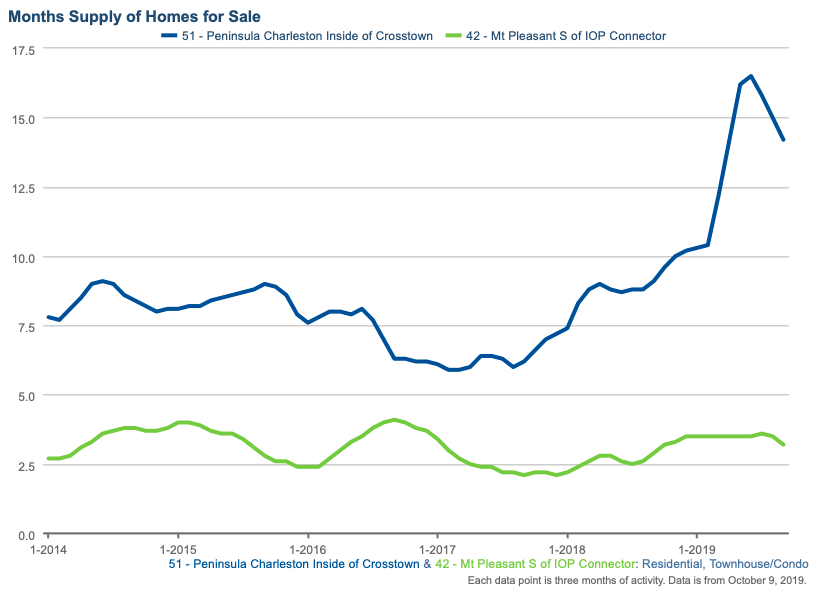
Inventory Levels
Let’s look at this next, as the level of inventory, or months supply, can drive prices and the number of sales. Keep in mind that 6 months inventory is considered a balanced market, less than that is a seller’s market, more than that is a buyer’s market.
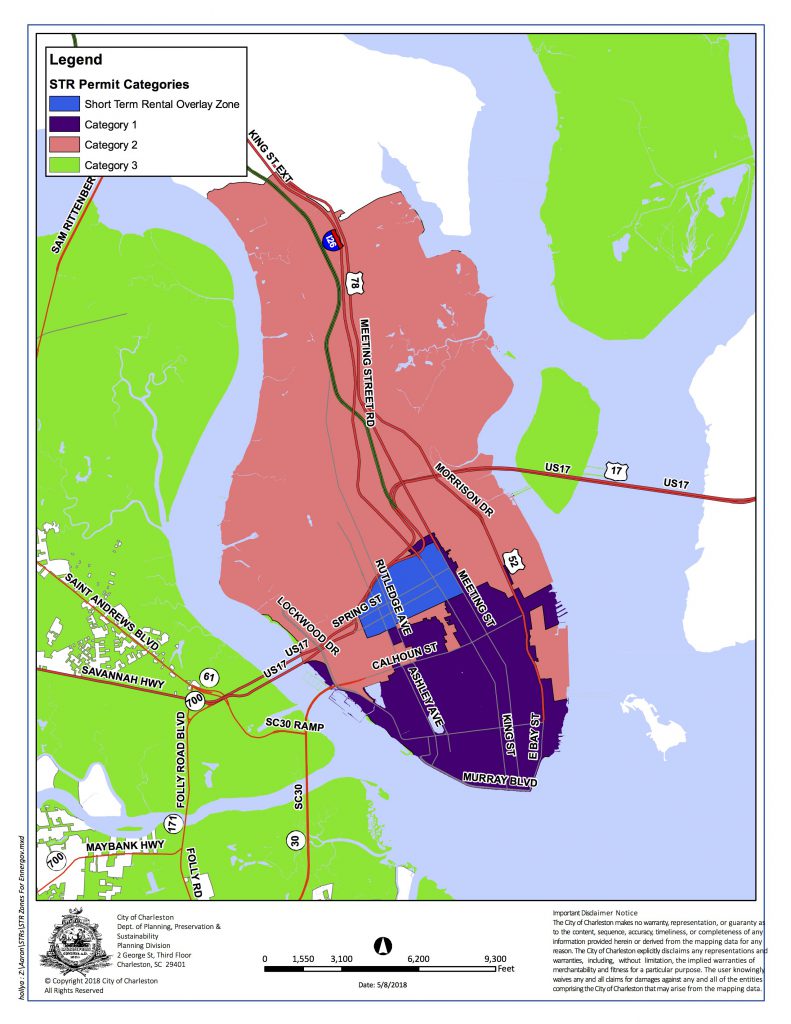
Wow. Will you look at that blue spike? Below the Crosstown we have 15.2 months of inventory, a 77% increase over this time last year. It’s a solid buyer’s market for sure! So why the drastic increase?? I believe in part, that it is a flood of former AirBnb properties coming on the market. Starting in July of 2018, with enforcement beginning December of 2018, property owners who have a second home in Downtown Charleston will receive major fines if they are found to be renting their out entire homes short-term (with some exceptions of course). It was always against City rules, it just wasn’t enforced. So now that they are no longer able to make money hand over fist renting to tourists, they are selling. I know off-hand at least 5 properties in one neighborhood for sale that were former AirBnbs. Even the Preservation Society of Charleston recently cited a CityLab article on Twitter stating….
Here in Charleston, the Short-Term Rental Ordinance is working and illegal vacation rentals are returning to the housing stock. https://t.co/j6PJLPannQ #chsnews #charleston #shorttermrental #str
— Preservation Society (@ThePSofC) July 16, 2019
They are right. And these high inventory levels are the result. As a result, there is zero sense of urgency with buyers, because they have more to choose from, and an overwhelming sense of what-the-hell-is-going-on on the sellers part, since this is a crazy market anomaly.
On James Island we have only 3.7 months of inventory, a 9% increase over last year, but it’s still a solid seller’s market. And in Mount Pleasant we have 4.5 months of inventory, a 25% increase over last year. Even though technically this is still a seller’s market, anecdotally I will say it is not. Buyers are getting more demanding with sellers, and it’s working. I for one am welcoming these slight increases in inventory in Mount Pleasant and James Island. For too many years, buyers had to fight over homes, which in turn drove the prices up. This new equilibrium is far better than drama and a stable market is a healthy one.
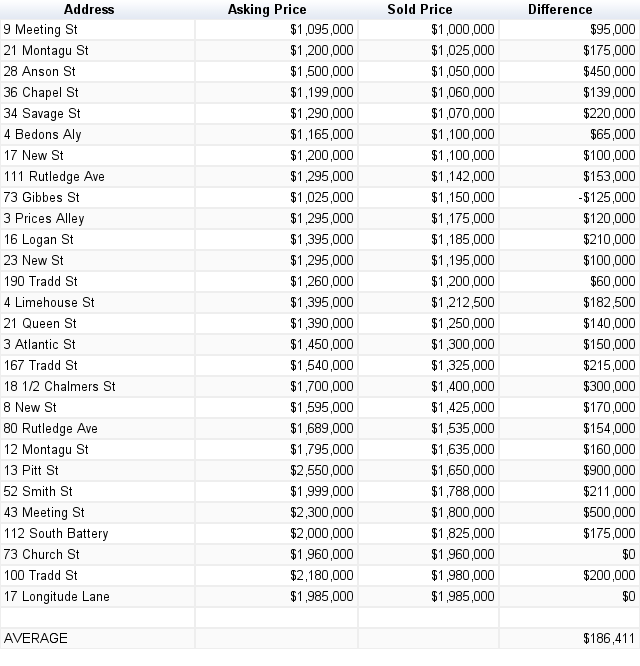
Median Prices
Now for everyones favorite, as you constantly refresh your Zillow profile for the latest home Zestimate….So I will make a bold statement here based on the numbers below (and above)…2018 was the official peak of the Downtown real estate market. Median prices for homes are down 13.7% over last year to $862,500. Why?? Because there aren’t as many buyers, and lots more sellers! Both James Island and Mount Pleasant saw a small drop in median prices, of 3.5% to $357,000 and 4.2% to $575,000 respectively (remember my comment about James Island being more affordable than Mount Pleasant?), but don’t let that fool you into thinking the market in general is collapsing. One little interesting tidbit regarding James Island, is that last year from May 1-July 31, there were 20 sales of homes over $800,000, many of which were brand new construction. This year in the same time frame, only 7 thus far!! And there aren’t even that many available currently. Additionally, other areas have seen significant increases in median prices over last year. West Ashley is up 13%, Johns Island 7%, Sullivan’s Island 12% etc….
I think it’s interesting to note however, that PENDING sales (homes under contract), in these areas are up over this time last year. Did we just have a slow-as-molasses start to 2019? Or did the amazing drop in mortgage rates, plus a decline in prices, plus more flexibility from sellers, plus more choices for buyers, create that magic formula?? We shall see….In the meantime, I look forward to the Downtown market shaking off its AirBnbs, and the other places getting to a stable happy place.