More stats than you can shake a stick at – Charleston 2016 Market Review
I’m not kidding. Try shaking a stick at all these stats I’m about to throw your way. As you know, I mostly like to write about the areas I love and with which I am intimately acquainted – namely, the Charleston Peninsula, parts of Mount Pleasant, and the Islands too. But every now and then it’s good for me to take a step back and get a larger view of the Charleston Metro Area – to see what areas are HOT, and what areas are NOT. After all I can’t become myopic in my perspective since what goes on ‘out there’, affects what goes on ‘in here.’
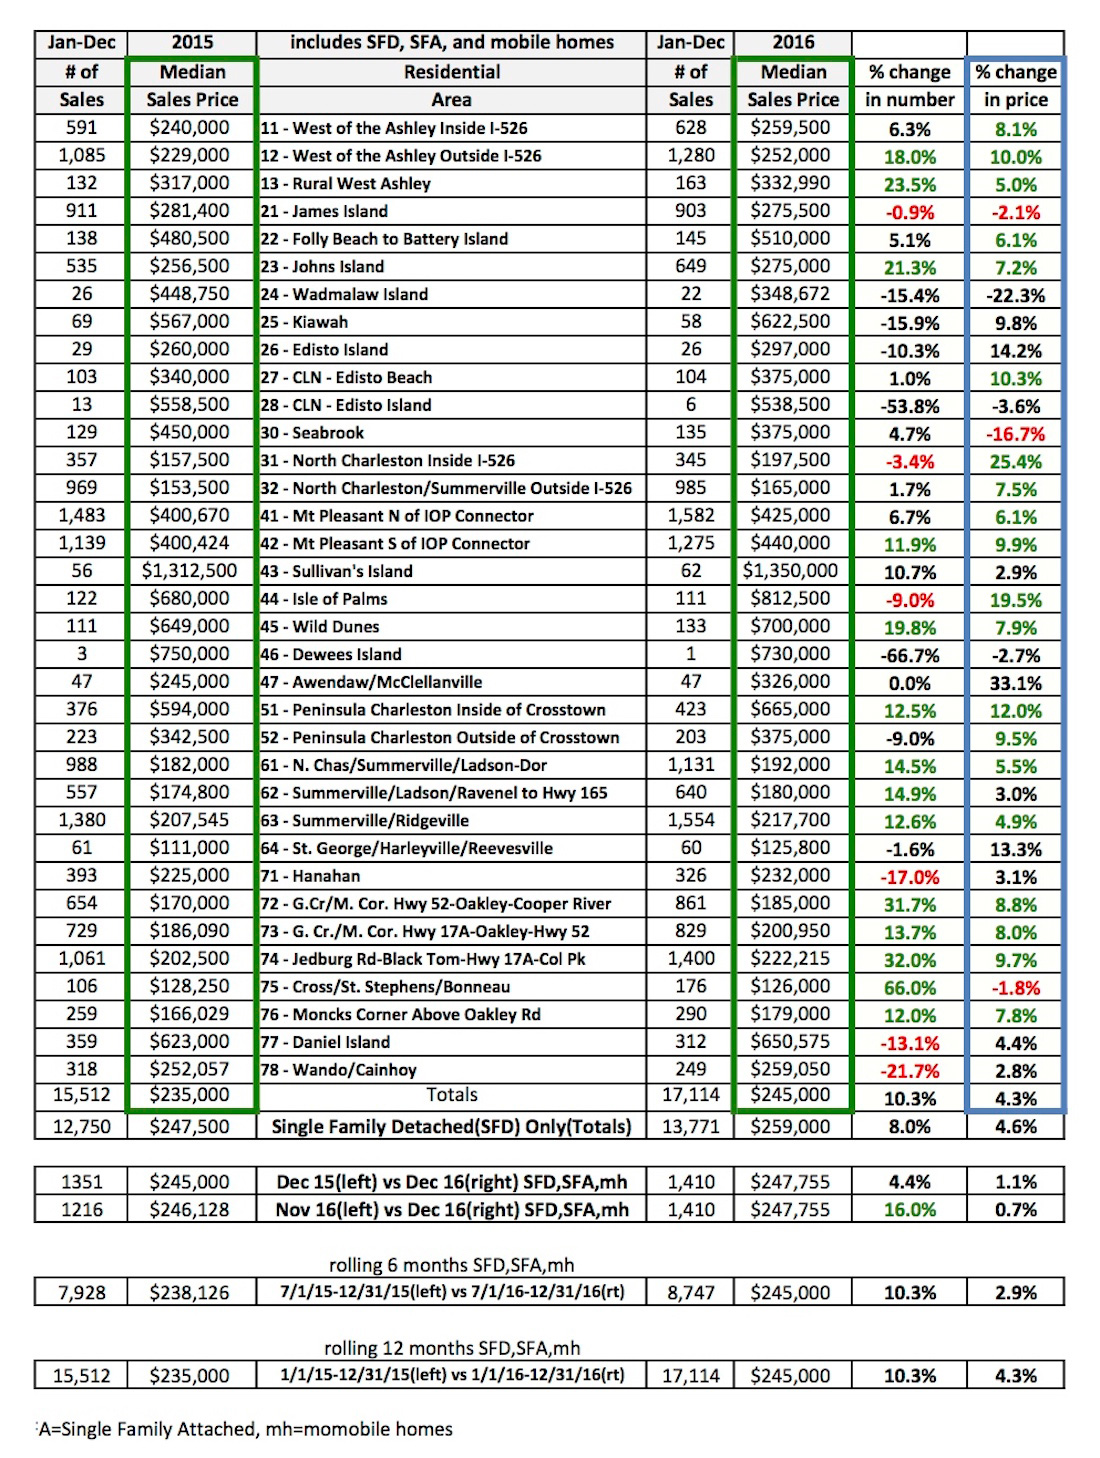
Before you take a look at this, I recommend letting your eyes adjust and allow me to walk you through how to interpret these numbers.
NOTE: Please ignore any of the Kiawah Island numbers because a majority of the Kiawah Island sales are handled through the Island’s private real estate company, and not reported on the Multiple Listing Service – the source of these statistics.
Year over Year Changes to Median Price and Number of Sales
- The numbers by the areas are how Realtors divide them up. So Downtown Charleston below the Crosstown is Area 51, Folly Beach is Area 22, etc…
- The left side is 2015 numbers, the right side is 2016 numbers, and the far right are the changes year over year.
- Those numbers on the far right are highlighted green if they are significantly above the average for the Metro Area, red if significantly below. NOTE: You may be confused by some of the numbers in black as they are far above or below the average. In most of those cases the number of properties sold wasn’t enough to be statistically notable – like Wadmalaw Island with only 22 sales, or Dewees with only 3.
- The last line on the bottom shows the totals, and percent changes for the Metro Area overall.
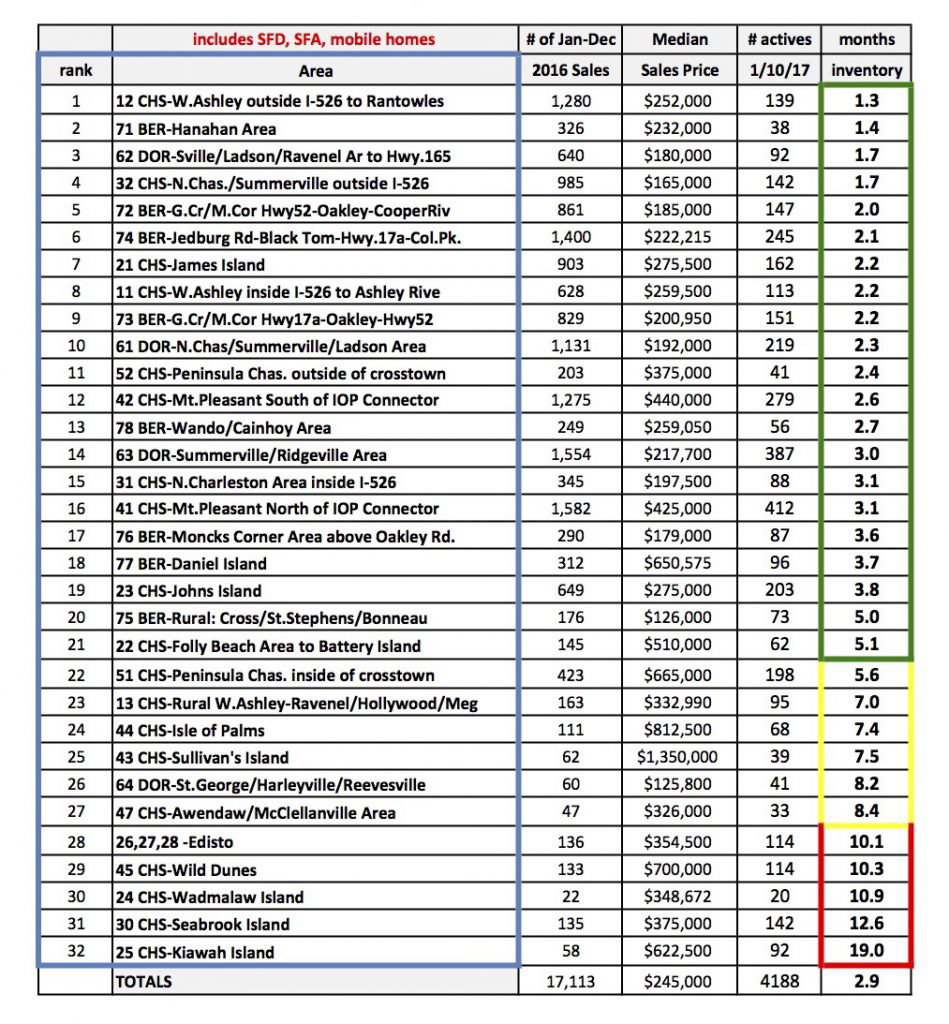
Here’s a PDF link if you want to make it larger.
So let’s look at what’s hot, and what’s not.
HOT
Number of Homes Sold
Anything ‘far out’ (if Downtown is the center of the region) slayed it this year! From Goose Creek and Summerville, to Outer West Ashley and more. There are tons of new neighborhoods going in, as well as more and more industry which provides jobs. To be perfectly honest, I have never even been to Cross/St. Stephens/Bonneau…and I couldn’t tell you where it is unless I googled it, but the number of home sales was up 66%!
Even Wild Dunes, a primarily resort destination, did better than expected in 2016. I’ve heard full time families are moving back in since it’s close to schools and a safe place for kids to become nature rats and beach bums.
Median Prices
North Charleston inside 1-526, and my beloved Isle of Palms are the clear winners here at 25.4% and 19.5% increase in median prices, respectively. Those areas are sort of on the opposite ends of the spectrum, but my bet is that part of North Charleston has become more convenient and accessible, while it is one of the most affordable areas to live. Isle of Palms had more than its usual share of high dollar sales this year with 7 sales over $3.5 million in 2016, 3 of which were over $5 million, compared to 4 sales over $3.5 million in 2015, none of which were over $5 million. With the relatively small number of homes sold on the Island, one could see how those big sales would spike up the median price.
NOT?
Number of Homes Sold
Hanahan and the Wando/Cainhoy area have had the biggest drop in sales. Is it lack of interest?? Or just no availability?? We’ll get to that later.
Median Prices
Well – only Wadamalaw and Seabrook Islands suffered a significant drop in prices, but given the small number of sales in both places in general – the median price can be affected by just a few high or low dollar sales.
Area Strength – Otherwise known as Months of Inventory
- This chart shows January-December 2016 compared to the number of properties on the market on 1/10/2017.
- This ratio is directly related to the simple months of inventory number.
- 6 months of inventory is considered a healthy, balanced market. Below 6 is a seller’s market, Above 6 is a buyer’s market – give or take…
Here’s a PDF Link if you want to make it larger.
HOT
Well – I think these numbers explain some of the declines in number of sales in certain areas. DEMAND FAR EXCEEDS SUPPLY and THERE ARE NO HOUSES TO BUY in pretty much anywhere in Berkeley County – particularly in hot little Hanahan and Goose Creek. Also, look at all of West Ashley, the Peninsula above the Crosstown, Inner Mount Pleasant, Wando/Cainhoy….Even Folly Beach is in high demand because prices there are half what they are on Sullivan’s Island and Isle of Palms.
Now, I expect as we enter our Spring selling season shortly, these inventory levels will ease up somewhat as more homes come on the market, but then again, there will also be more buyers out looking. So for Buyers, I cannot stress enough that you must be prepared. No dilly dallying or loose ends to tie up if you want to buy a house in the next 6 months.
NOT?
Seabrook, Edisto, Wadmalaw…Both Seabrook and Edisto were hurt by Hurricane Matthew which obviously affected sales the last three months of 2016. Seabrook recovered quickly but Edisto is still digging out. At Wadmalaw, there are only 20-25 homes on the market on Wadmalaw at any given time. Though the island is quite large, much of it is farmland and marsh. (Actually one of my favorite places to visit).
And despite what I said about Kiawah earlier – I find it interesting that it seems everyone wants to sell their vacation homes there? Where is the next hot spot? Closer to town?
Conclusions
After all those stats your mind may be swimming, but here are my thoughts on the story these numbers tell.
FRENZY
Peninsula above the Crosstown – Median prices have DOUBLED here in the past 5 years. This compares to the average for the area which is around a a 25% increase. The price for a house above the Crosstown is starting to exceed (if it hasn’t already) the salaries of those who want to live here. I’m not saying prices won’t increase more since the area is still developing, but it does make one take a second glance.
OPPORTUNITY
Folly Beach – about the the same distance from Downtown Charleston as Sullivan’s Island and Isle of Palms, Folly is half the price of those two so I think there is opportunity for major growth here. Consider this – On Isle of Palms, a nice 4,000 sq ft oceanfront house will cost you at least $3,000,000. On Folly Beach, that same house will go for $1,000,000+ less.
West Ashley – median prices are almost half what they are in Mount Pleasant. If you only look at the homes in the area versus homes and condos, the median price in Mount Pleasant is above $500,000. West Ashley homes are in the high 200s, and our new Mayor John Tecklenburg is dedicated to revitalizing this area. While inventory levels are at an all time low, if you can find yourself a house to buy – do it.
So obviously the Charleston market overall is looking strong and exuberant. We still have jobs and tourists coming in droves. But where do you think it will go in 2017?? Only the numbers will tell.
 Previous Post